
When code runs but does the wrong thing, reading it again only goes so far. The debugger of Oracle Forms Builder shows the code running: it stops at chosen lines, executes one statement at a time, and shows the values of variables and items.
This guide covers debugging in Oracle Forms 14.1.2: running a form in the debugger, setting breakpoints, stepping through code, the debug panes, the DEBUG package, attaching the debugger to a form that is already running, and simpler techniques for when the debugger is not at hand.
Sample Form for This Guide
The examples and screenshots use the sample form CH26_ERRORS from the Oracle Forms code repository on GitHub. Download it, open it in Forms Builder, and connect as CAREWELL to follow along.
| Form | File | What it shows |
|---|---|---|
| CH26_ERRORS | forms/ch26/ch26_errors.fmb | Dr. Sara Nair's appointments, with database errors turned into clear messages |
The forms run against the CareWell Clinic sample schema, which you install first.
Debugger Commands at a Glance
| Command | Key | What it does |
|---|---|---|
| Debug Module | Shift+F9 | Compiles the form with debug information and runs it. |
| Step Into | F7 | Runs one statement, entering the procedures it calls, even those of an attached library. |
| Step Over | F8 | Runs one statement, including whole procedure calls. |
| Step Out | Ctrl+F7 | Runs to the end of the current procedure. |
| Run to Cursor | Shift+F4 | Runs to the line of the cursor. |
| Go | F9 | Runs to the next breakpoint, or on. |
| Stop | None | Ends the form. |
Run a Form in the Debugger
Debug, Debug Module (Shift+F9) compiles the current form with the information the debugger needs, and runs it as Program, Run Form does. A form compiled with frmcmp_batch gets that information with debug=yes, as shown in how to compile Oracle Forms modules. The form runs normally until it reaches a breakpoint.
Set a Breakpoint
Open the code in the PL/SQL Editor and choose its Debug tab, which numbers the lines. Double-clicking a line sets a breakpoint, shown as (BRK). The Breakpoints pane lists the breakpoints set.
Debug, Insert/Remove Breakpoint (F5) is meant to do the same for the line of the cursor, but in testing on Forms Builder for Linux it stayed disabled, and double-clicking the line was the way.
Stop and Step
With a breakpoint on the one line of the sample errors form's ON-ERROR trigger, saving an appointment for patient 99999 stopped the form. Its window no longer answered, and in the editor the line showed (BRK)=>, the next line to run. The Debug menu then enabled its commands.
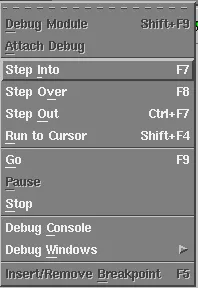
Step Into on cw_err.on_error opened the body of the CW_ERR package from the attached library, and three Step Overs later the editor showed the next line to run as 00012=>.
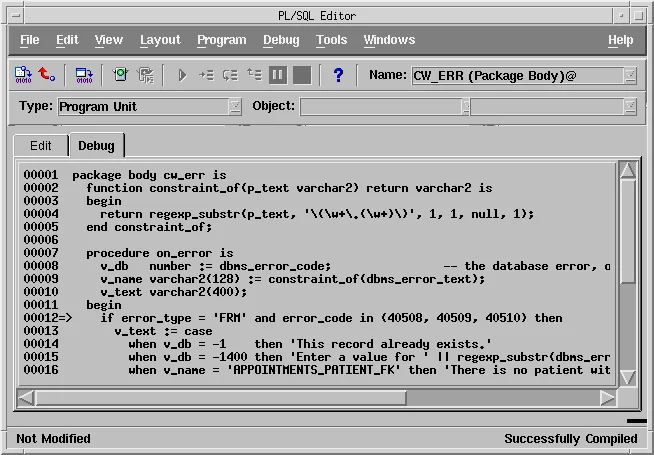
The code being debugged here is explained in how to handle errors in Oracle Forms using ON-ERROR.
The Debug Windows
Debug, Debug Console opens a window that shows the debugger's panes, chosen with its toolbar or with Debug, Debug Windows:
| Pane | Shows |
|---|---|
| Stack | The chain of calls that led to the current line. |
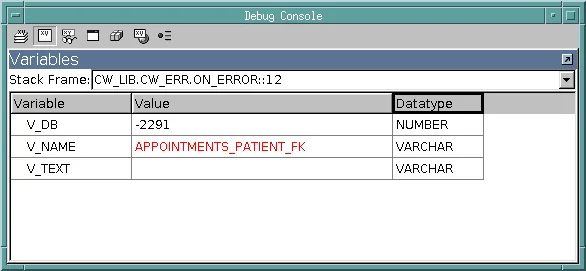
| Variables | The variables of the current procedure, or of another stack frame. |
| Watch | Variables you chose to follow. |
| Form Values | The items of the form's blocks, and its parameters. |
| Breakpoints | The breakpoints set. |
| PL/SQL Packages | The variables of the packages in use. |
| Global/System Variables | The global and system variables. |
Here is the Variables pane for ON_ERROR at line 12: the database error, and the constraint that CONSTRAINT_OF found. Values that changed at the last step are shown in red.
The DEBUG Package
The built-in package DEBUG lets code work with the debugger.
Syntax:
debug.suspend                                    -- stops here, like a breakpoint
debug.getc(varname varchar2) return varchar2     -- getd, geti, getn: a date, integer, number
debug.setc(varname varchar2, newvalue varchar2)  -- setd, seti, setn
debug.interpret(input varchar2)                  -- runs a debugger command
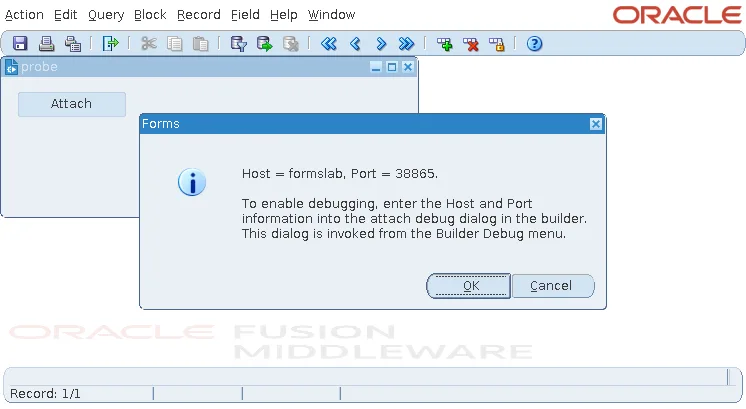
debug.attach                                     -- shows how to attach the debugger
DEBUG.SUSPEND is a breakpoint written in the code, useful inside a condition, so it stops only when the case you are looking for happens.
Example:
if v_total < 0 then debug.suspend; end if;
GETC, GETD, GETI, and GETN read, and SETC, SETD, SETI, and SETN change, the variables of the stopped code.
Attach the Debugger to a Running Form
DEBUG.ATTACH supports the other way to start the debugger: attaching it to a form that is already running, for example one started by a user on a test server. Called in the running form, it shows the host and the port to connect to, and says what to do with them. Enter them in the dialog of Debug, Attach Debug in Forms Builder.
Other Ways to Look
The debugger is not always at hand. Three simpler techniques remain useful:
- MESSAGE with the values you want to see. Add SYNCHRONIZE after it when the screen must be redrawn before the code goes on, as in a loop; see SYNCHRONIZE in Oracle Forms.
- A trace file written with TEXT_IO, recording the triggers that fire and the values they see, as in how to trace the firing order of triggers.
- Help, Display Error (Shift+Ctrl+E), which shows the statement and the database error behind the last FRM- error.
The Forms server can also write a trace of a session, every event, trigger, and statement, for problems that only appear on the server.
Conclusion
Debug Module (Shift+F9) runs an Oracle Forms form in the debugger. Set breakpoints by double-clicking lines in the PL/SQL Editor's Debug tab, step with Step Into, Step Over, and Step Out, and inspect the Stack, Variables, Form Values, and other panes of the Debug Console. Use DEBUG.SUSPEND to stop only in the case you are chasing, DEBUG.ATTACH with Attach Debug to debug a form that is already running, and MESSAGE, a TEXT_IO trace, or Display Error when the debugger is not at hand.
