
The classic report is the oldest report type in Oracle APEX, and still one of the most useful. It runs a query and displays the rows as an HTML table, or as cards, a list, or a timeline, depending on its template.
Users can sort it and page through it, but they cannot filter it, hide columns, or save their own versions. That simplicity is the point: a classic report does exactly what you tell it, looks exactly as you design it, and is fast. In this tutorial you build a Top Customers report with colored tier badges, currency formatting, and a link to the customer form.
Classic Report or Interactive Report?
Reach for a classic report when you want full control of the output: fixed lists, summaries on a dashboard, reports embedded in other pages, and anything that must look exactly one way. Choose an interactive report when users need to filter, group, chart, and save their own views.
Creating a Classic Report Page
You can drag Classic Report from the gallery onto an existing page, or build a page around one with the Create Page wizard.
- On the application home page, click Create Page, then Classic Report.
- Enter a page number and a name such as Top Customers. Keep Page Mode as Normal, and leave Include Form Page off if a form already exists.
- Under Data Source, change Data Source from Sample Data to Local Database, and set Source Type to SQL Query.
- Enter your query in the code editor.
- Under Navigation, keep the defaults and enter an icon such as fa-trophy.
- Click Create Page.
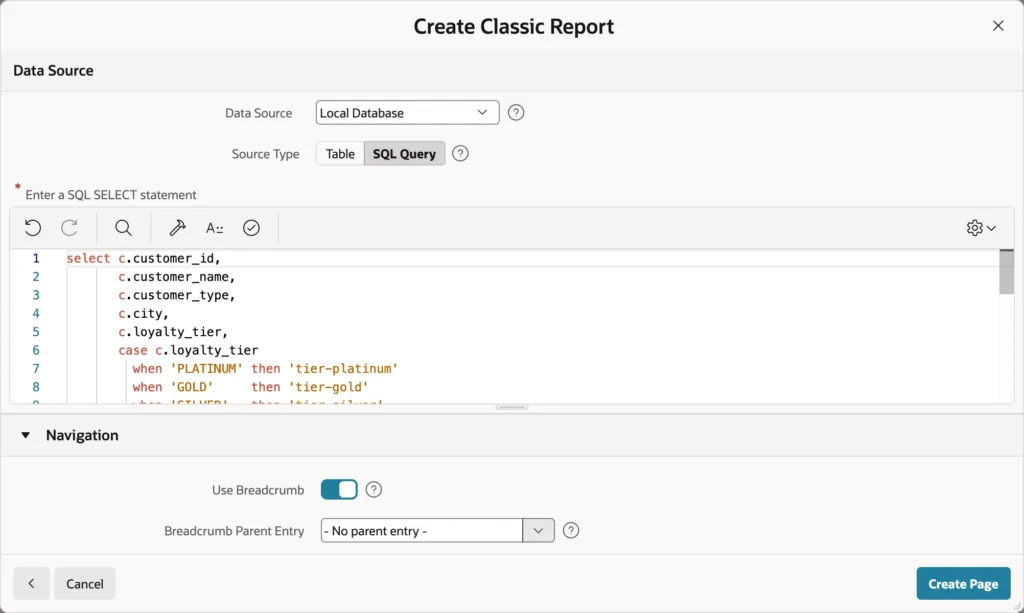
select c.customer_id,
       c.customer_name,
       c.customer_type,
       c.city,
       c.loyalty_tier,
       case c.loyalty_tier
         when 'PLATINUM' then 'tier-platinum'
         when 'GOLD'     then 'tier-gold'
         when 'SILVER'   then 'tier-silver'
         else                 'tier-bronze'
       end                  as tier_class,
       count(o.order_id)    as orders,
       sum(o.order_total)   as total_sales,
       max(o.order_date)    as last_order
  from orb_customers c
  join orb_orders o
    on o.customer_id = c.customer_id
 where o.status <> 'CANCELLED'
 group by c.customer_id, c.customer_name, c.customer_type,
          c.city, c.loyalty_tier
The query returns one row per customer with at least one order that was not cancelled. TIER_CLASS is not meant to be displayed: it computes a CSS class name from the loyalty tier, which you will use to color the badges. Notice there is no ORDER BY, because you will make the report sortable declaratively instead.
APEX 26.1 adds Sample Data as a data source, and the wizard selects it by default. Sample data is a set of built-in rows that lets you design a report before its real source exists. When you are ready, switch Location to Local Database and enter your table or query.
The Region's Source
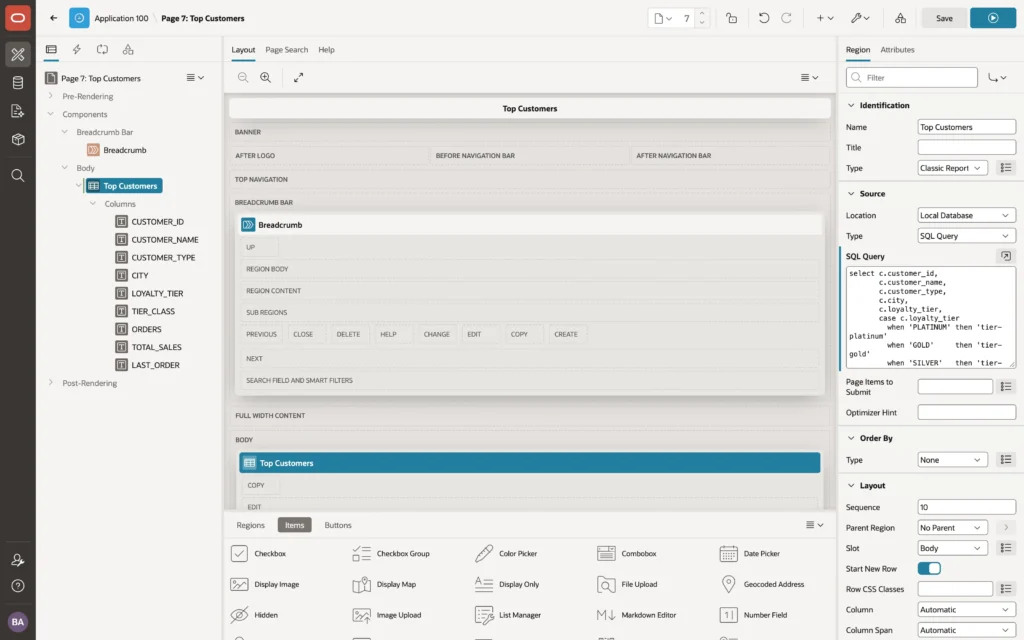
Select the region and look at its Source group.
- Location: Local Database, REST Enabled SQL, REST Source, JSON Duality View, JSON Source, or Sample Data.
- Type: Table or View, SQL Query, Function Body returning SQL Query for reports whose structure changes at run time, or Property Graph.
- SQL Query: the query itself, with a code editor button and a Validate action.
- Page Items to Submit: items whose values the report needs when it refreshes without reloading the page.
- Optimizer Hint and Order By: an optional hint, and an order applied to the rows.
A report query can use bind variables such as :APP_USER for the signed-in user, or a page item like :P7_REGION. Always use bind variables rather than string concatenation. They are safe from SQL injection and let the database reuse the query plan.
Column Properties
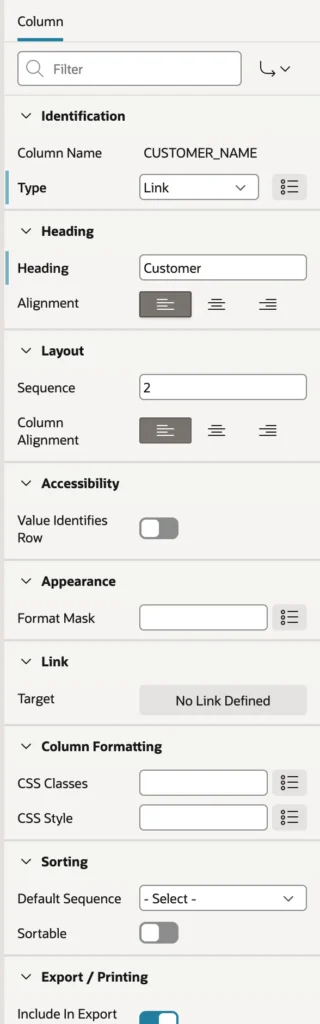
Every column has its own properties. Select one under Columns to see them.
Column Types
| Type | Displays |
|---|---|
| Plain Text | The value as text, escaped so HTML in the data is shown, not run |
| Plain Text (based on List of Values) | The display value of a list of values, such as a name for an ID |
| Rich Text | Markdown or HTML in the data, rendered as formatted text |
| Link | The value as a link to a page or URL |
| Display Image | An image stored in a BLOB column |
| Download BLOB | A link to download a file from a BLOB column |
| Percent Graph | A number from 0 to 100 as a horizontal bar |
| Hidden | Nothing, but the column stays available to other columns |
Hidden columns are more useful than they sound. CUSTOMER_ID and TIER_CLASS are needed by the report but should never appear, so set both to Hidden.
Headings, Alignment, and Format Masks
The wizard turns column names into headings, so TOTAL_SALES becomes Total Sales. Change the ones that need it, then use Heading Alignment for the heading and Layout Column Alignment for the values.
Appearance Format Mask formats numbers and dates. Two are worth memorizing.
| Mask | Result |
|---|---|
| FML999G999G990D00 | Local currency, group, and decimal separators, so the same mask gives $1,234.50 in the US and 1.234,50 € in Germany |
| SINCE | How long ago a date was, such as 5 days ago, which often beats the date itself. SINCE_SHORT is the compact form |
HTML Expressions
Column Formatting HTML Expression replaces a column's output with HTML of your own, in which a column name between hash signs stands for that column's value in the row. It is how you build badges, icons, and two-line cells.

<span class="tier-badge #TIER_CLASS#">#LOYALTY_TIER#</span>
Each tier is now wrapped in a span with two classes: a shared one, and the class computed by the query. Style them with page-level CSS, which you enter under CSS Inline on the page properties.
.tier-badge {
  display: inline-block;
  padding: 2px 10px;
  border-radius: 999px;
  font-size: 11px;
  font-weight: 600;
  letter-spacing: .03em;
}
.tier-platinum { background: #e3e7ee; color: #2c3e50; }
.tier-gold     { background: #f8e3a3; color: #6b4e00; }
.tier-silver   { background: #e9eef2; color: #4a5a68; }
.tier-bronze   { background: #f3d4b8; color: #7a3f12; }
"Escape special characters is on for every column by default, and you should leave it on."
That setting makes APEX escape the values it substitutes into an HTML expression, so a customer named after a script tag is displayed as text instead of running as code. Turn it off only for HTML you generate yourself from data users cannot change, and prefer the Rich Text column type for HTML stored in the data.
The other Column Formatting properties style a column without HTML. CSS Classes and CSS Style apply to every cell, and Highlight Words highlights given words, or the value of a page item such as a search field. For whole-row effects, see how to highlight a row based on a condition.
Linking a Column to Another Page
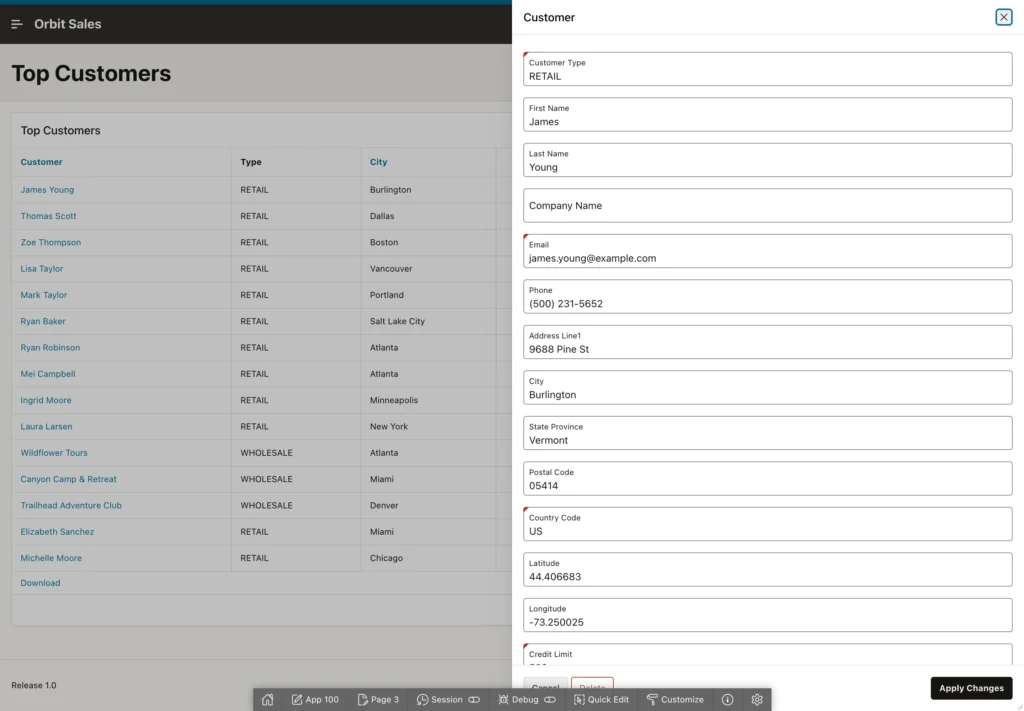
To make customer names open the customer form, set the column Type to Link and click No Link Defined next to Link Target. The Link Builder opens.
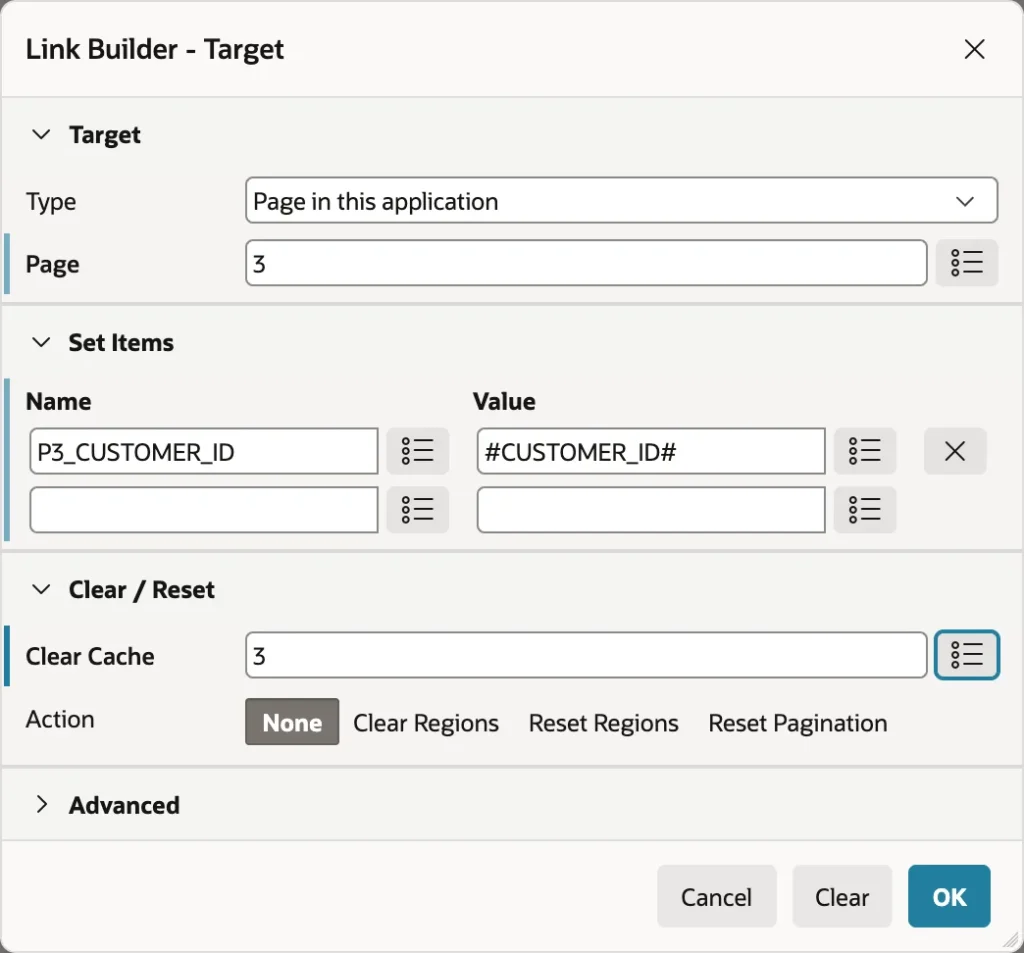
- Set Type to Page in this application, and Page to your form page.
- Under Set Items, enter the form's item name and the value from the row, written as the column name between hash signs.
- Enter the page number in Clear Cache, so the form forgets the customer it showed before.
- Click OK.
The link text defaults to the column value, and the Link Text and Link Attributes properties let you change it to an icon or add a tooltip. If the target is a modal dialog page, the link opens it as a drawer over the report. The same builder appears wherever APEX needs a link, and it always adds the checksum that page access protection requires. Compare this with link columns in interactive reports, which work the same way.
Sorting
Classic report columns are not sortable until you say so. Select a column, switch on Sorting Sortable, and its heading becomes a link that sorts the report, reversing the order when clicked again.
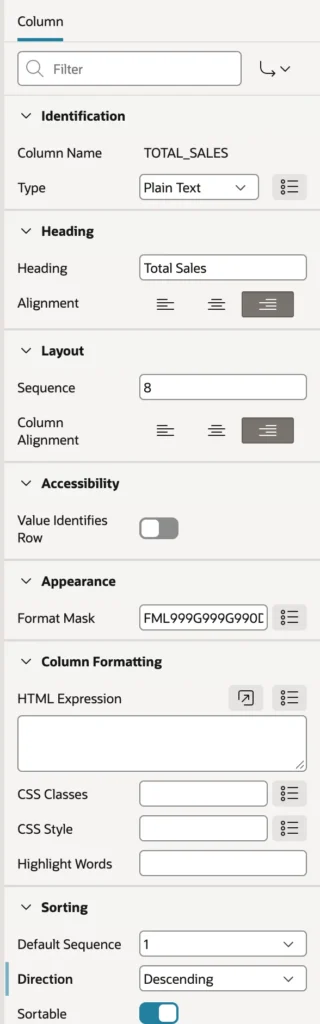
To sort the report when it first appears, give a column a Default Sequence of 1 and a Direction. APEX remembers each user's chosen sort as a user preference, so people see the report the way they left it, and the region's Sort Nulls attribute decides whether empty values come first or last.
Do not mix an ORDER BY in the query with sortable columns, because the result is hard to predict. For a sortable report, leave ORDER BY out and use Default Sequence and Direction. For a fixed order, use ORDER BY and leave the columns unsortable.
Report Attributes
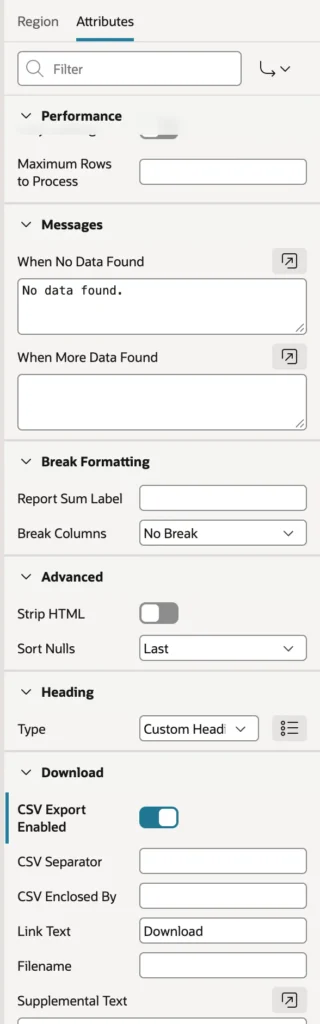
Select the region and open the Attributes tab. These settings affect the report as a whole.
Layout and Templates
Number of Rows sets the rows per page, 15 by default, or the value of a page item if you set Number of Rows Type to Based on Item Value, which lets users choose.
Template decides what the report looks like. Standard is the familiar table, while Value Attribute Pairs shows each row as label and value pairs, ideal for the details of one record. Alerts, Badge List, Cards, Comments, Content Row, Media List, Search Results, and Timeline display rows in those styles, provided the query returns the column names each template expects. For new pages, the dedicated Cards, Content Row, and Timeline regions are easier than these report templates.
Template Options adjust the Standard template: Stretch Report fills the region width, Alternating Rows and Row Highlighting control striping and hover, and Report Border chooses horizontal, vertical, or no borders.
Pagination
| Type | Behavior |
|---|---|
| No Pagination | All rows at once. Fine for short lists, dangerous for long ones |
| Row Ranges X to Y | Next and Previous links without counting the rows |
| Row Ranges X to Y of Z | Shows the total, but APEX must count every row |
| Row Ranges 1-15 16-30 | Links or a select list for each range |
| Search Engine 1,2,3,4 | Page numbers, like a search engine |
With a few hundred rows, counting is cheap. On a table of millions, prefer a type that does not count, and set Maximum Rows to Process to limit the work. Partial Page Refresh, on by default, pages and sorts without reloading the page, and Lazy Loading shows the page first and the report afterwards, which makes a slow report feel faster. You can also refresh a report automatically at an interval.
Messages, Headings, and Breaks
- When No Data Found sets the empty-state text. No data found is rarely the best you can do, because No customers match your search is friendlier.
- Heading Type chooses custom headings, column names, a PL/SQL function body, or none.
- Break Columns show the value of the first columns only when it changes, grouping rows visually. Order the query by those columns for it to make sense.
- Report Sum Label names the totals row that appears when columns have Compute Sum switched on.
Downloading
Switch on CSV Export Enabled and a Download link appears below the report. You can change the separator, which matters in countries where the comma is the decimal separator, along with the link text and file name. Columns with Include In Export switched off are left out. For more control, you can always build the CSV in PL/SQL yourself. The Printing group adds PDF output, which needs a print server or document generator.
The Finished Report
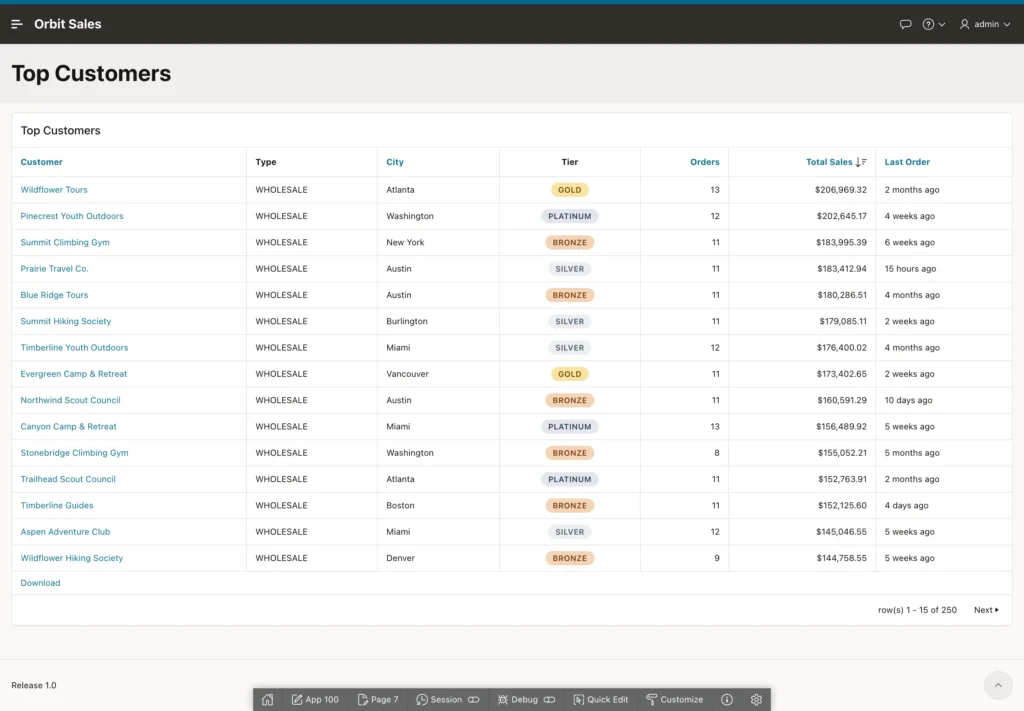
The best customers come first, tiers are colored badges, sales are formatted as currency, and the last order shows how long ago it was. Below the report sit the Download link and the pagination.
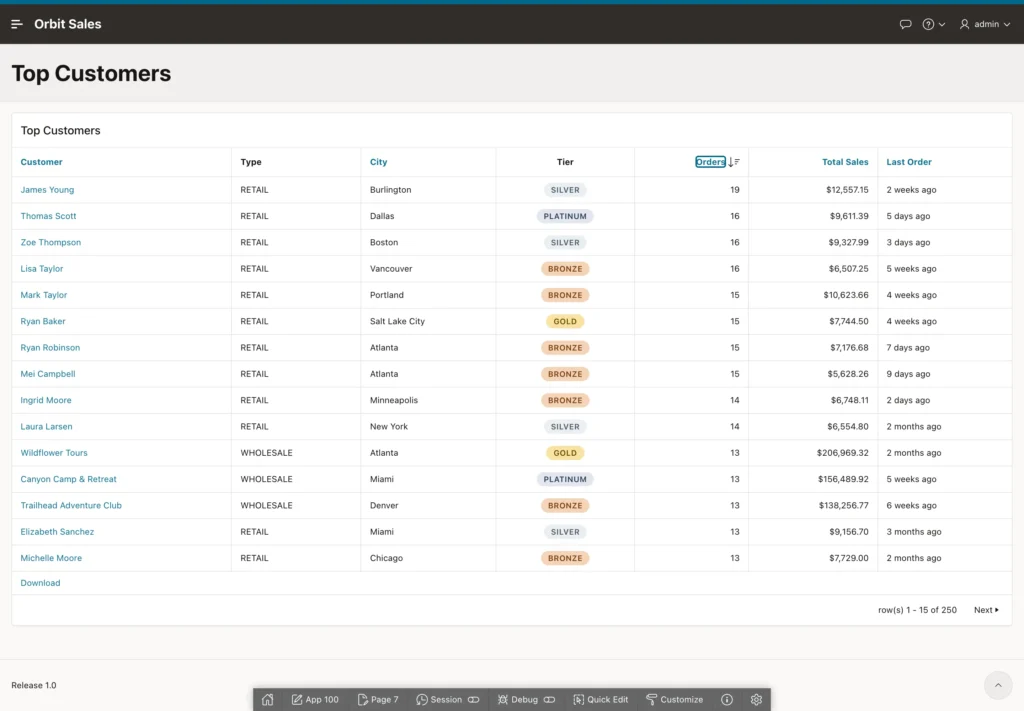
Try changing the template to Value Attribute Pairs and the number of rows to 3, and the same query becomes a set of record cards. Switch Report Border to No Borders to see how far the template options go, then put everything back.
Conclusion
A classic report runs your query and displays the rows exactly as you design them, which makes it the right choice whenever predictability matters more than user-driven exploration. You build one on a table or a SQL query, hide the columns users do not need, set headings and alignment, and format values with masks such as FML for local currency and SINCE for relative dates. An HTML expression turns a plain value into a colored badge using a class computed by the query, while Escape special characters keeps that output safe from anything a user might type into your data. The Link Builder connects a column to a form page and passes the row's key, sortable columns plus a default sequence control the order, and the report attributes decide pagination, templates, empty-state messages, break formatting, and CSV download. Learn these settings once and every classic report you build afterwards is mostly a matter of writing the right query.
