
The interactive report is the report users love. It looks like a classic report, but it adds a search bar and an Actions menu that let every user filter, sort, highlight, group, chart, and download the data, then save the result as a report of their own.
That matters because business users who would otherwise export everything to a spreadsheet can answer their own questions without leaving the application. This guide builds an Orders report, walks through every feature from a user's point of view, then covers the developer settings that decide what users may do, including the row selection and natural language support added in APEX 26.1.
Creating an Interactive Report
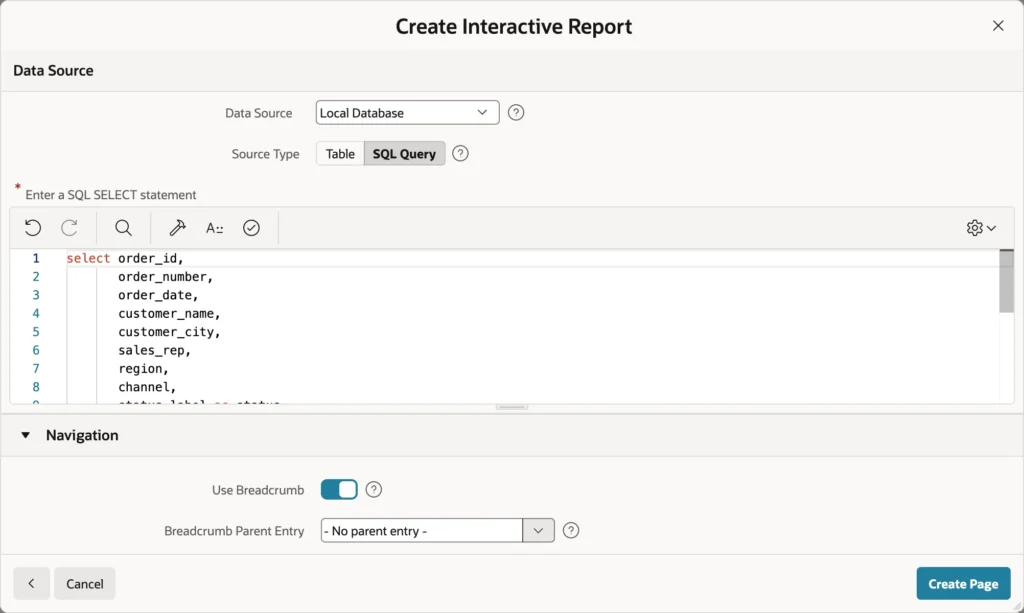
Create the page with the Create Page wizard, exactly as you would a classic report.
- On the application home page, click Create Page, then Interactive Report.
- Enter a page number and a name such as Orders.
- Set Data Source to Local Database and Source Type to SQL Query, then enter your query.
- Enter an icon such as fa-shopping-cart, and click Create Page.
select null as row_selector,
       order_id,
       order_number,
       order_date,
       customer_name,
       customer_city,
       sales_rep,
       region,
       channel,
       status_label as status,
       item_count,
       order_total,
       shipped_date
  from orb_orders_v
The query reads a view that joins each order to its customer, sales representative, and warehouse. It selects only the columns the report needs, and renames STATUS_LABEL to STATUS so users see Pending Approval rather than a raw code. The first column, ROW_SELECTOR, returns nothing on purpose: it is a placeholder for the row selection checkboxes you add later.
Tidying the Columns
Interactive report columns have most of the properties of classic report columns, including Type, Heading, alignment, Format Mask, HTML Expression, and links.
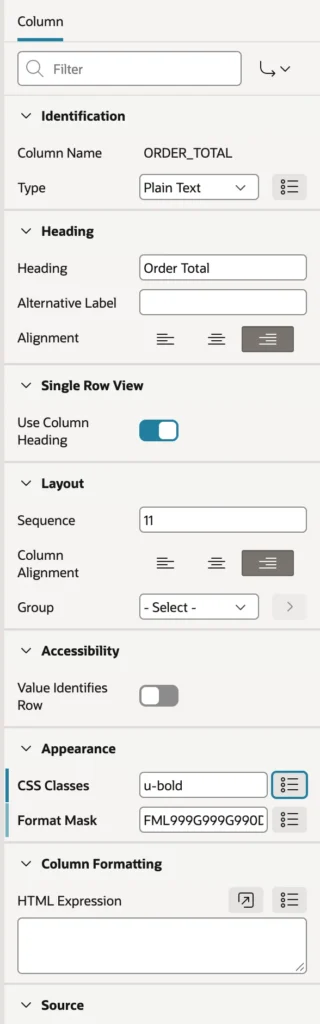
| Column | Change |
|---|---|
| ORDER_NUMBER, CUSTOMER_NAME, CUSTOMER_CITY | Shorter headings such as Order, Customer, and City |
| ORDER_DATE, SHIPPED_DATE | Format mask DD-MON-YYYY |
| ORDER_TOTAL | Format mask FML999G999G990D00, and the CSS class u-bold |
That CSS class is new in APEX 26.1, which gives interactive report columns an Appearance CSS Classes property. The utility class u-bold makes totals bold, and your own classes can color a column, set its width, or hide it on small screens.
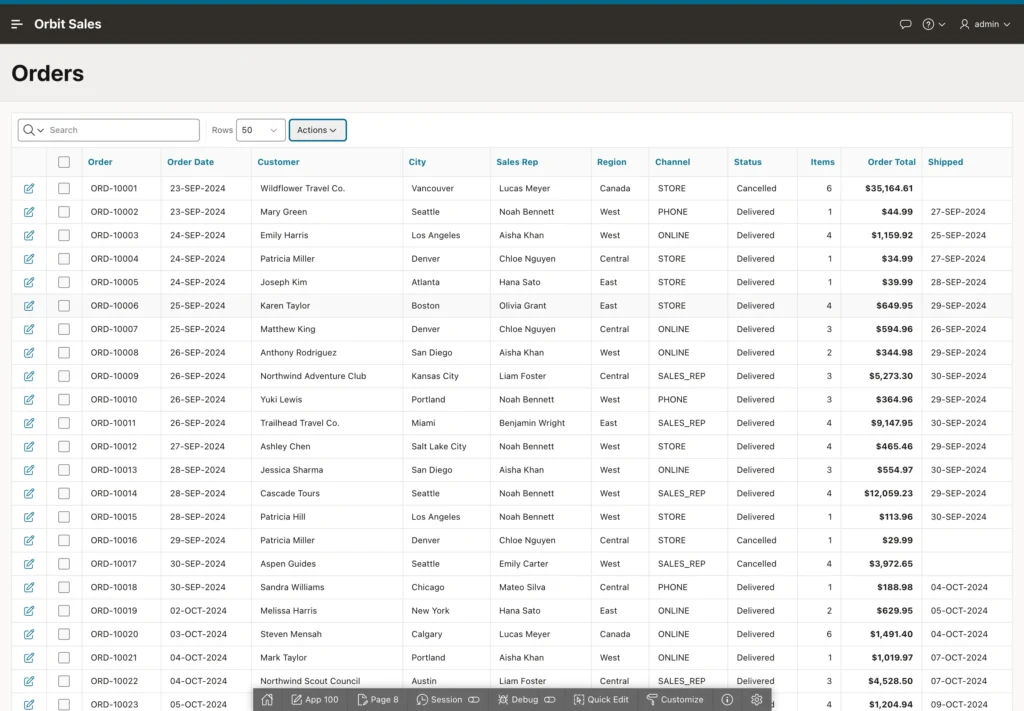
The Report as Users See It
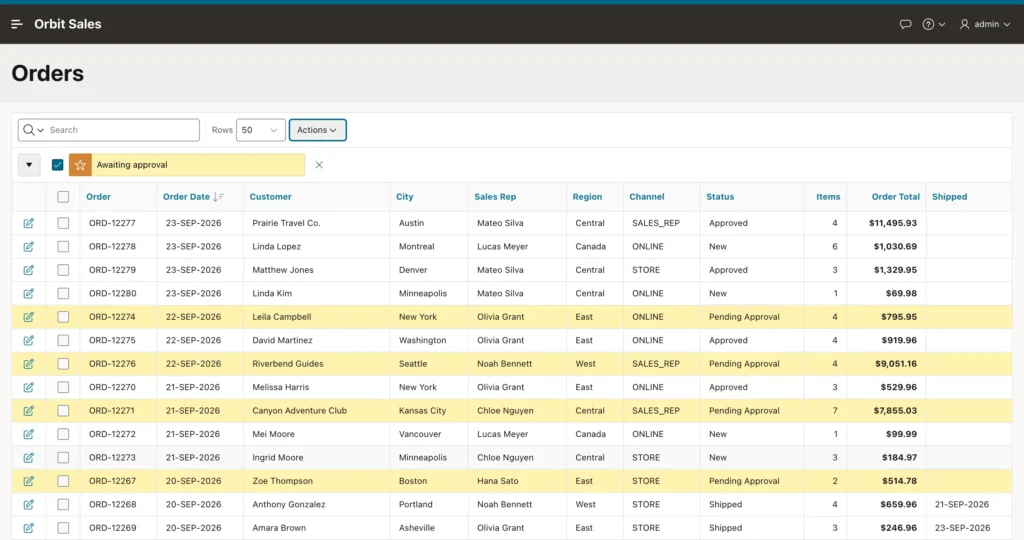
Above the report sits the search bar: a search field with a column menu, a Rows selector, and the Actions menu. Each column heading is a menu too. Everything a user does is remembered for that user, so leaving the page and coming back shows the report as they left it.
Searching
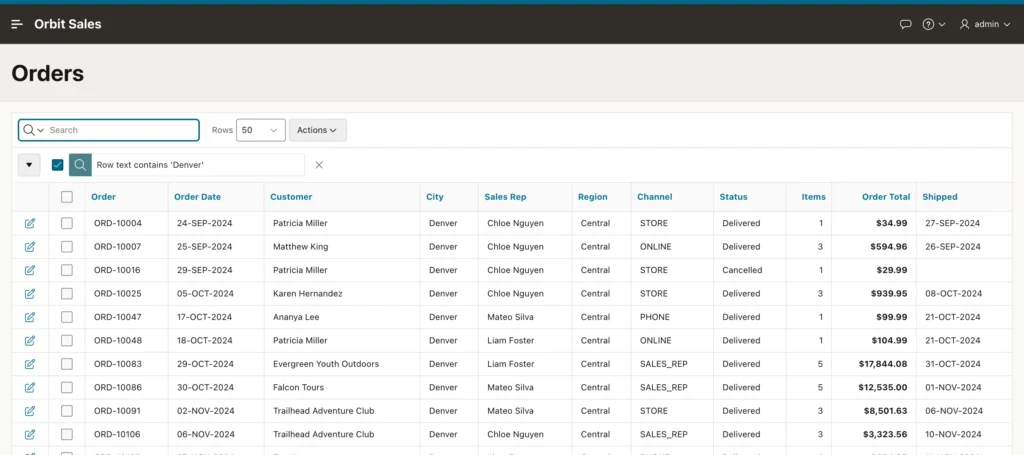
Type a city name and press Enter, and the report shows only rows where some column contains it. The magnifying glass opens a menu for searching a single column instead of all of them, which is close to the incremental search pattern you may have built by hand before.
Every setting a user applies appears as a line above the report, with a checkbox to switch it off temporarily and a cross to remove it. Click the text of a setting to edit it.
The Column Heading Menu
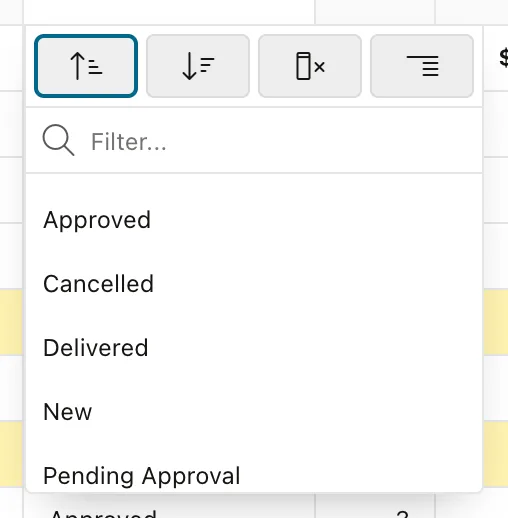
Click a heading and a small menu opens with buttons to sort ascending or descending, hide the column, and create a control break, plus a filter field and the column's distinct values. Click a value and the report filters to it. For most everyday questions, the heading menu is all users need.
The Actions Menu
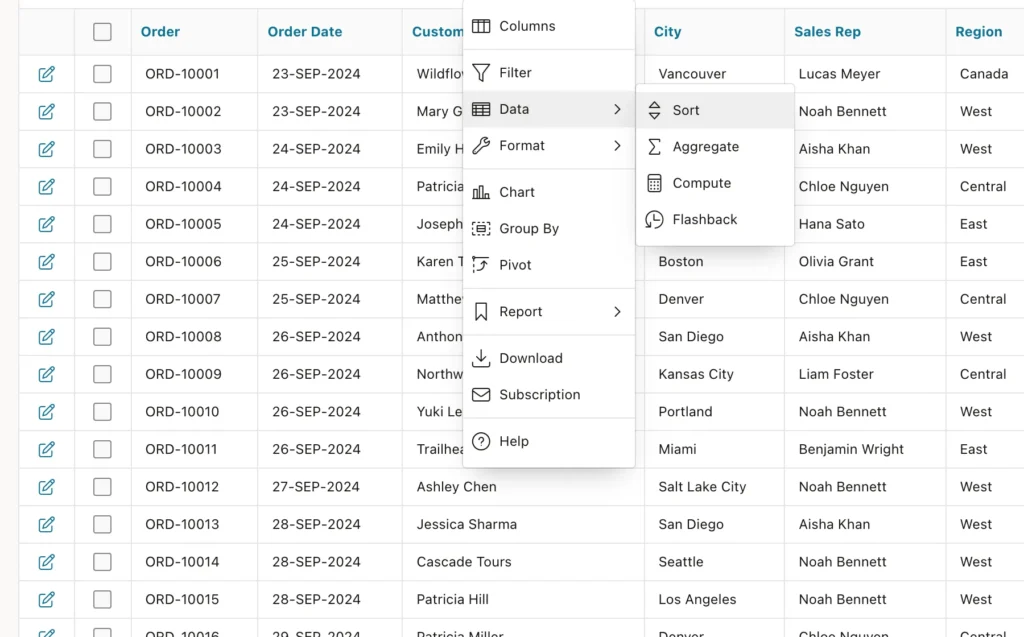
| Entry | Does |
|---|---|
| Columns | Choose which columns to display, and in what order |
| Filter | Add a column filter, or a row filter combining columns |
| Data | Sort on up to six columns, aggregate, compute a column, or flash back to earlier data |
| Format | Control break, highlight, and rows per page |
| Chart | Show the data as a bar, line, area, or pie chart |
| Group By and Pivot | Summarize rows, or turn values into columns |
| Report | Save Report and Reset |
| Download and Subscription | Download the data, or receive it by email on a schedule |
Filtering
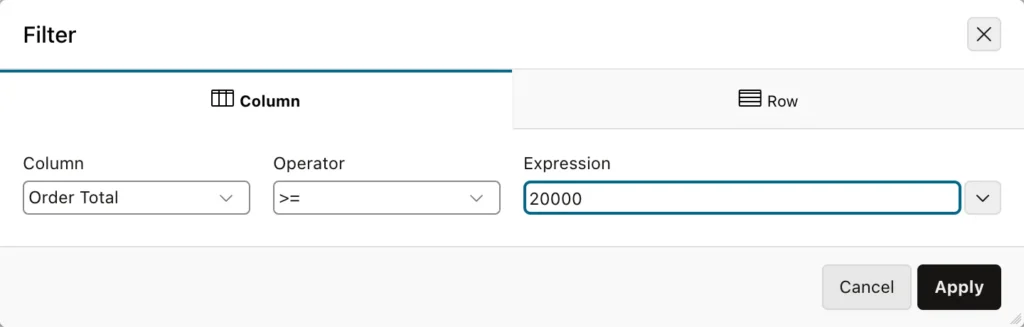
A column filter compares one column with a value using operators chosen for its data type, from equals and between through contains and matches regular expression. Date columns add operators such as is in the last and is in the next. A row filter is a condition written with the column aliases shown in the dialog, for conditions that combine several columns.
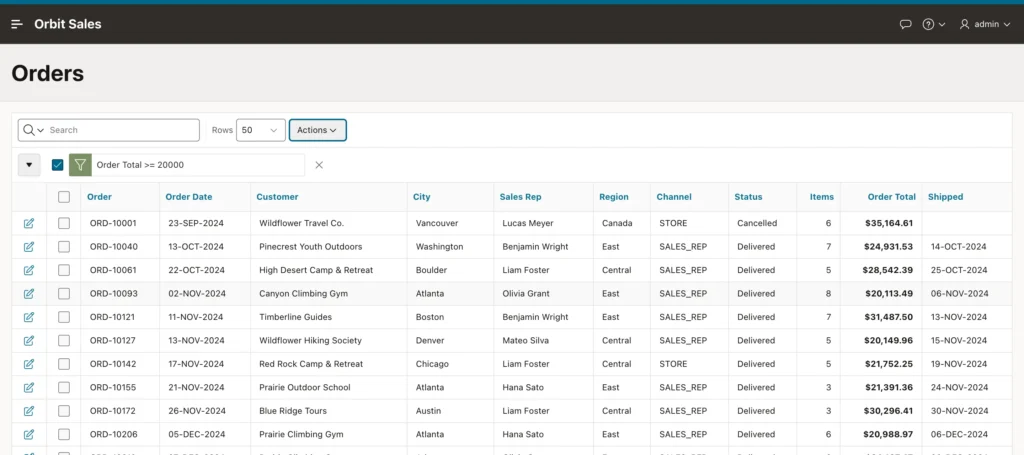
Actions, then Report, then Reset removes all of a user's settings and returns the report to its default.
Sorting and Highlighting
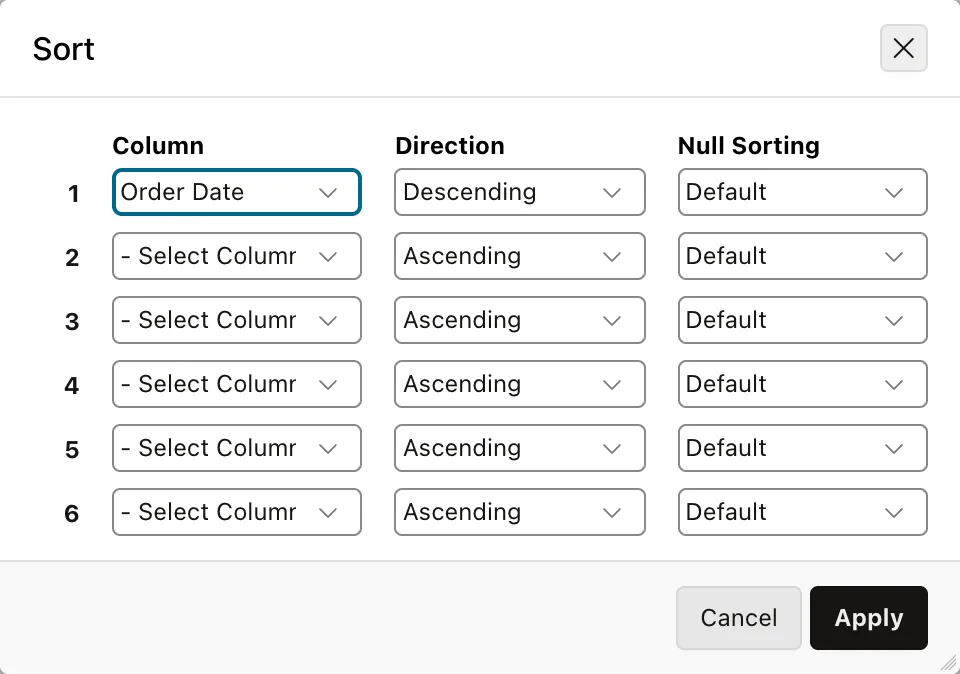
Reports usually open with the oldest rows first, which is rarely what anyone wants. Actions, Data, Sort fixes that in a few clicks.
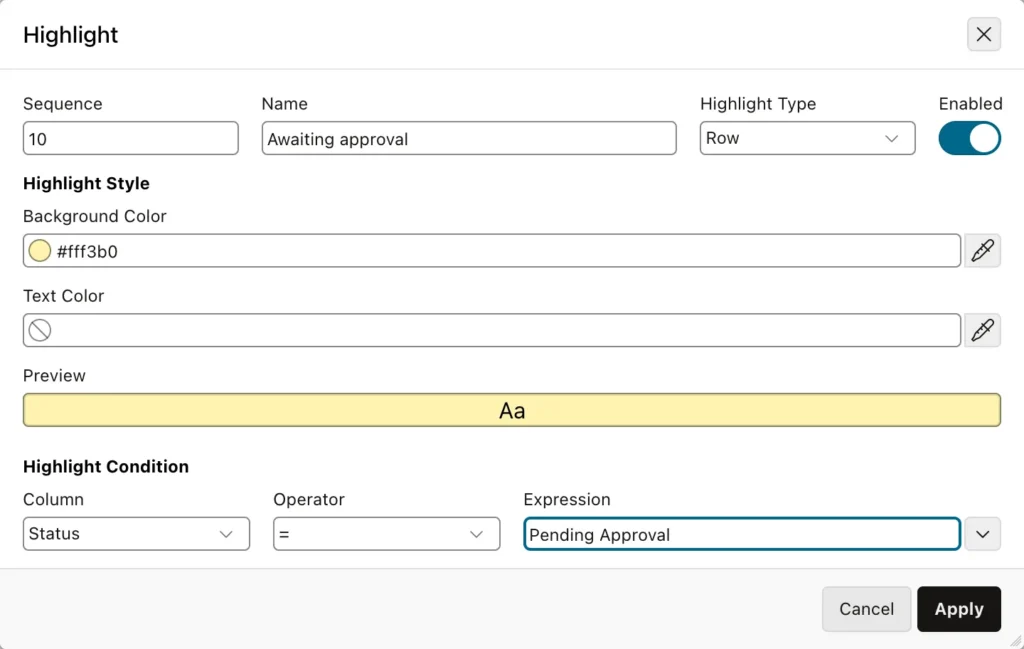
Highlighting draws the eye to rows that need attention. Give the rule a name, choose Row to color the whole row or Cell for just the column in the condition, pick a background color, and set the condition. It is the user-driven version of the developer technique for highlighting report rows.
Saving the Default Report
So far only you see this layout. As a developer you can make it the default for everyone through Actions, Report, Save Report, where developers get an extra Save list.
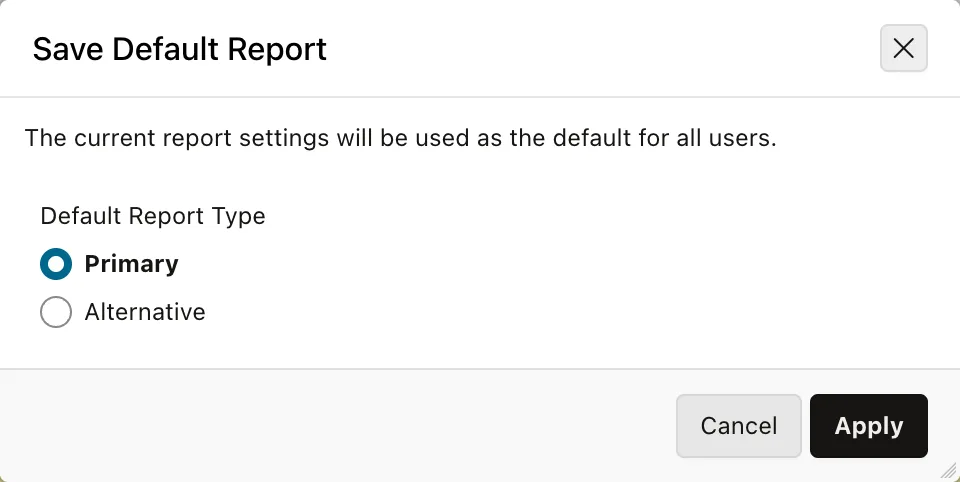
- As Default Report Settings replaces the report's default layout, which every user sees until they change it. You choose whether to replace the Primary report or create an Alternative report that users can pick from the reports list.
- As Named Report saves a report of your own, exactly as any user can.
Once saved as the primary report, Reset returns users to your layout rather than the original one.
Control Breaks and Aggregates
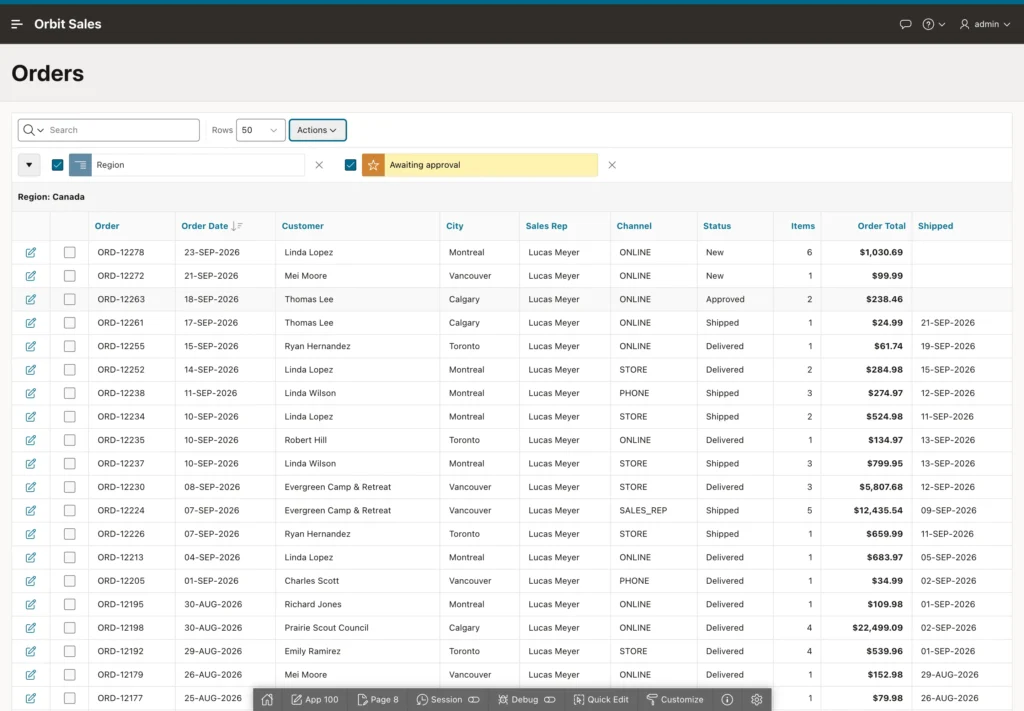
A control break groups rows by a column's values, and an aggregate adds a sum, average, count, minimum, or maximum at the end of each section and for the whole report. Compute adds a column calculated from others using the column aliases, and Flashback shows the data as it was a given number of minutes ago, which is handy right after an accidental change.
Charts
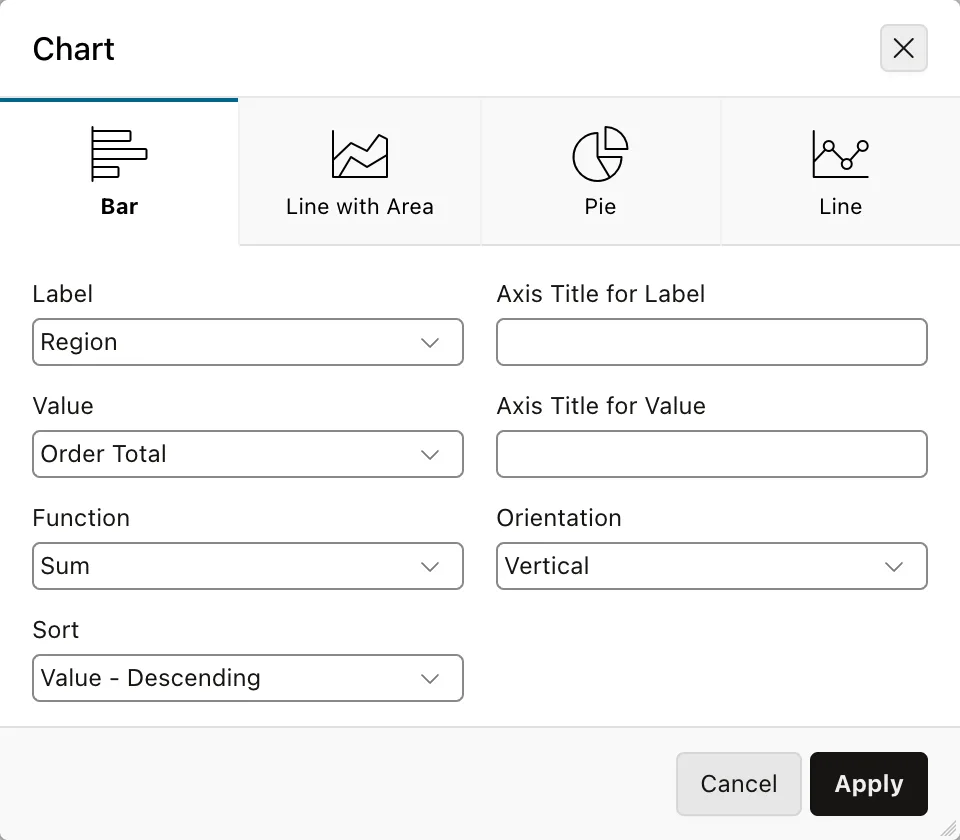
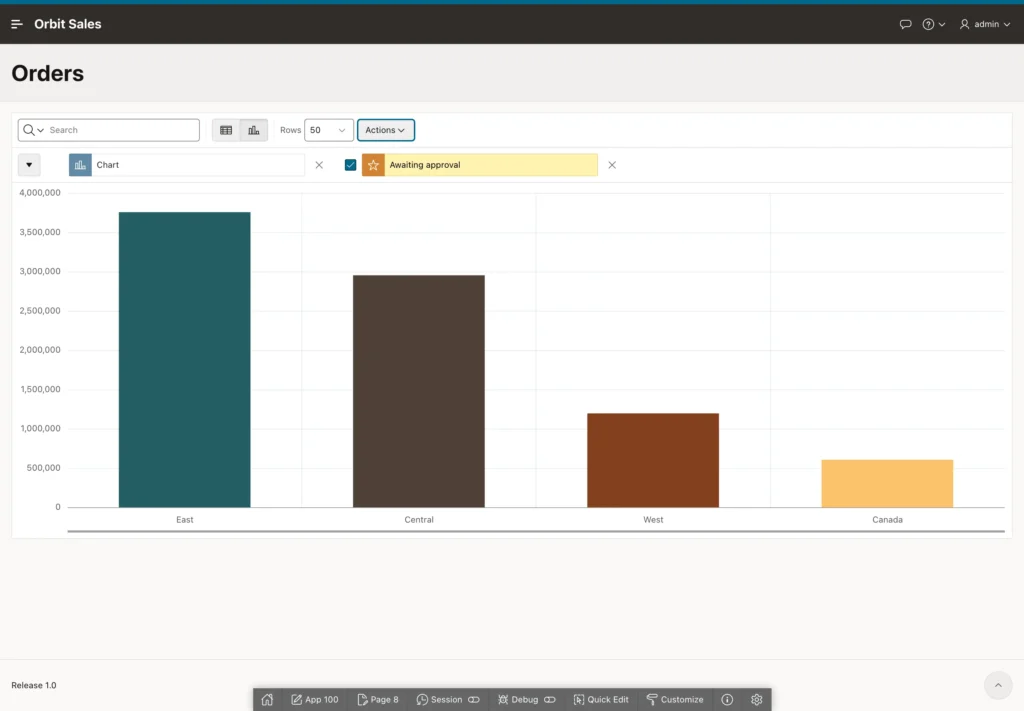
Choose a chart type, a label column, a value column, and a function such as Sum, and the report becomes a chart. Two icons beside the search bar then switch between the report view and the chart view.
Group By and Pivot
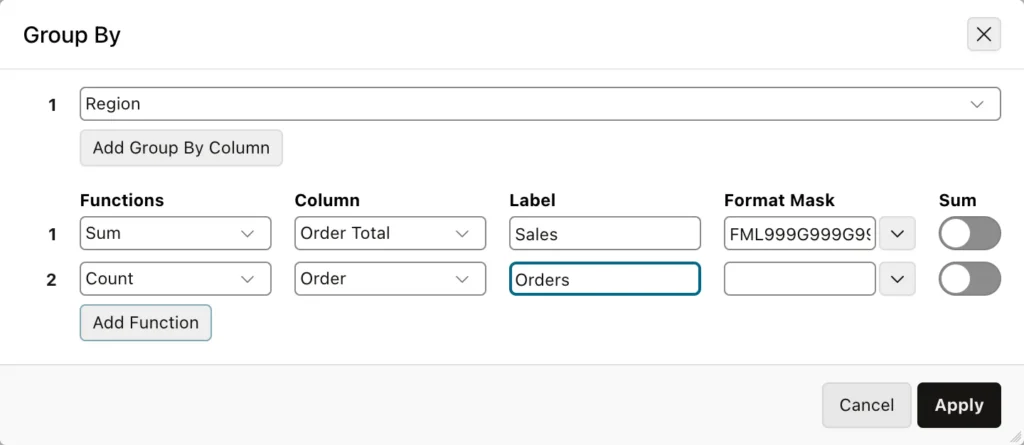
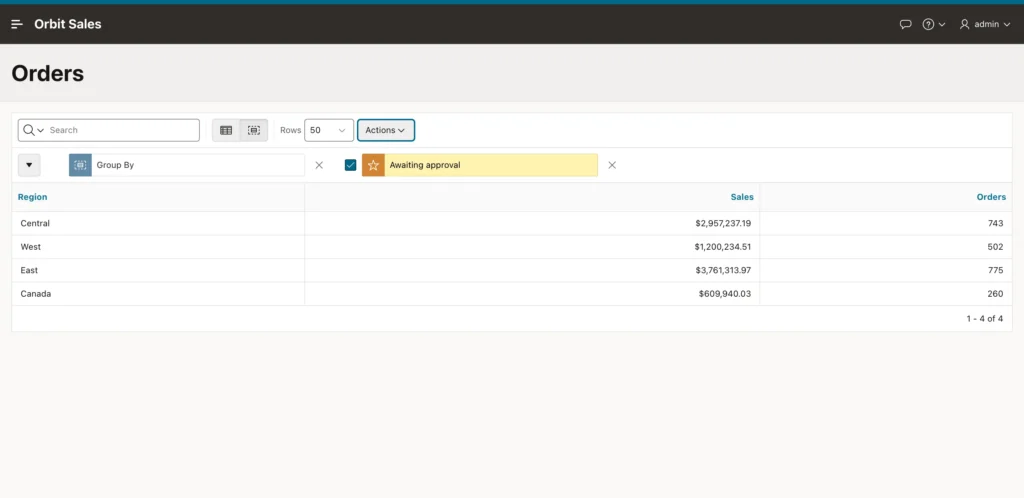
Group By summarizes the data in a table: choose the grouping columns, then add functions such as a sum of order totals labeled Sales and a count of orders. Each function can have its own format mask. Pivot goes further, turning the values of a column into columns, such as one row per region and one column per sales channel.
Saving a Named Report
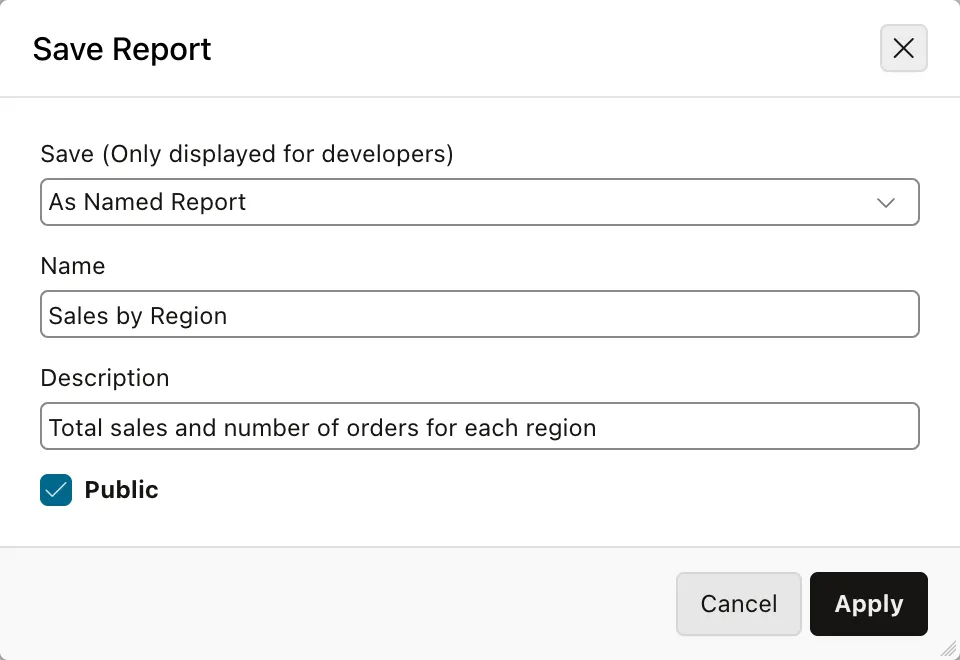
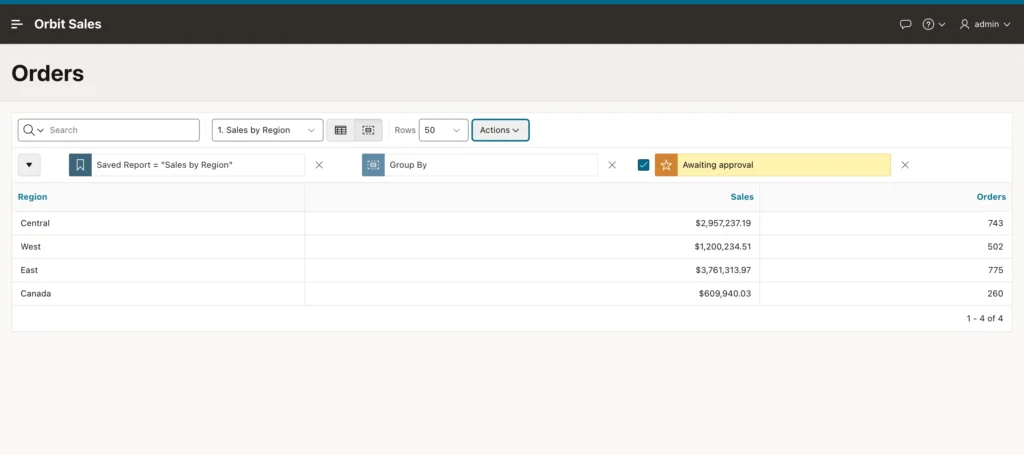
A useful summary is worth keeping. Save it as a named report, add a description, and mark it Public so everyone can use it. A reports list then appears in the search bar, where users choose between the primary report, alternative reports, their own private reports, and public ones.
Users can save private reports whenever Save Report is enabled. Saving public reports is off by default and must be switched on in the report's attributes.
Downloading and Subscriptions
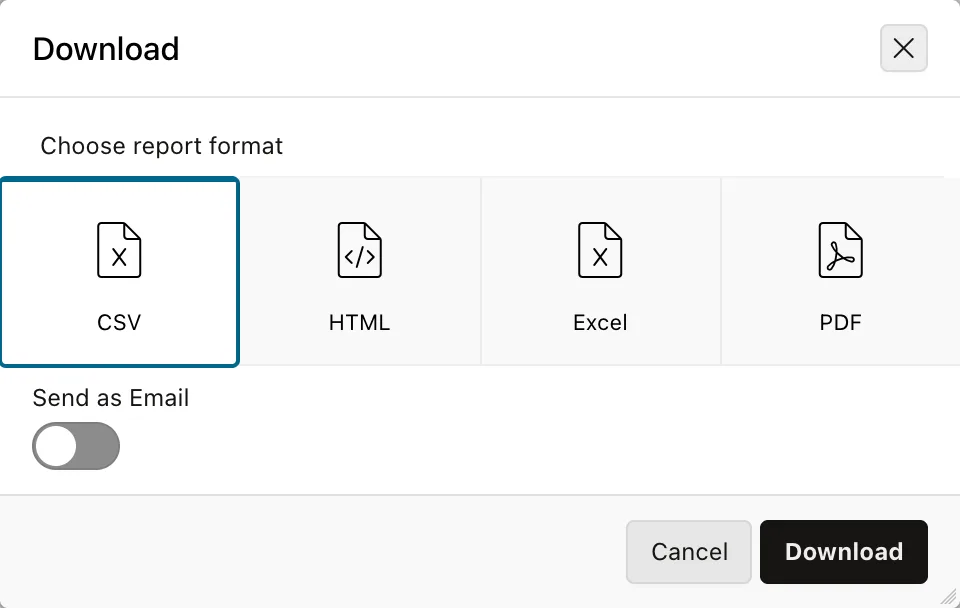
Download offers the report with the user's filters, columns, and settings applied, and Send as Email mails the file instead. Subscription emails the report daily, weekly, or monthly. Both need the instance email settings configured. If you need a download from elsewhere in the app, see how to download an interactive report from another page.
The Single Row View
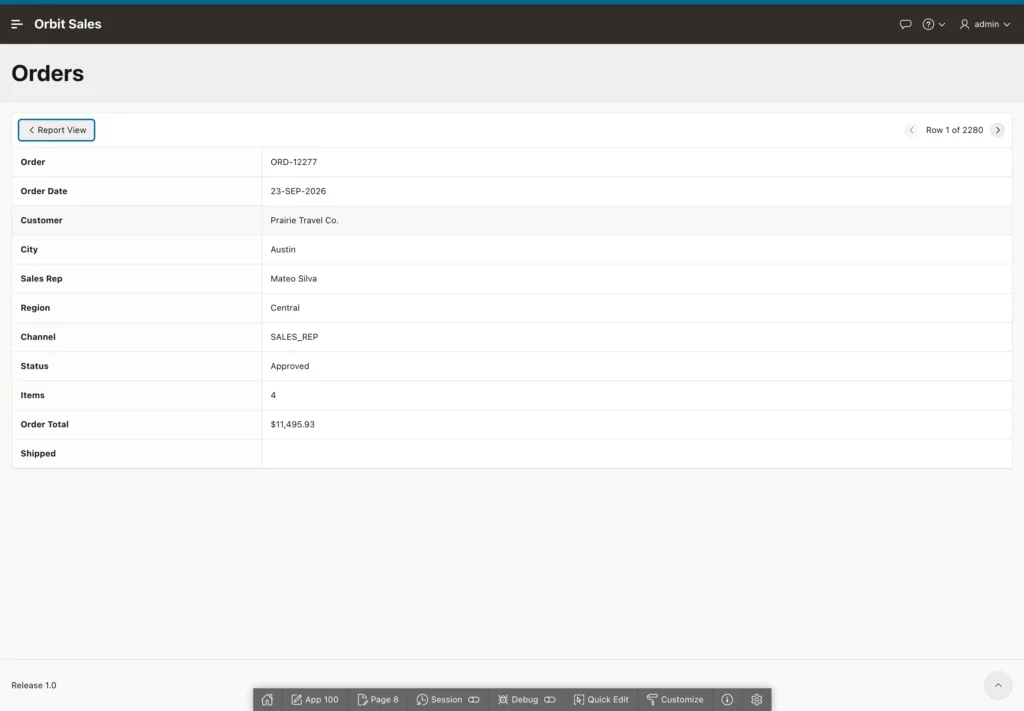
Each row can start with a pencil icon that opens the single row view: every column of one row as a vertical list, with Previous and Next to move through rows. It is a quick way to read a wide row without building a form, and you can replace it later with a link to a real form.
Row Selection in APEX 26.1
Interactive reports can now let users select rows with checkboxes, as interactive grids always could. Selected rows can then be processed by a button, a dynamic action, or a process, which is how you approve several orders at once.
Row selection needs two things.
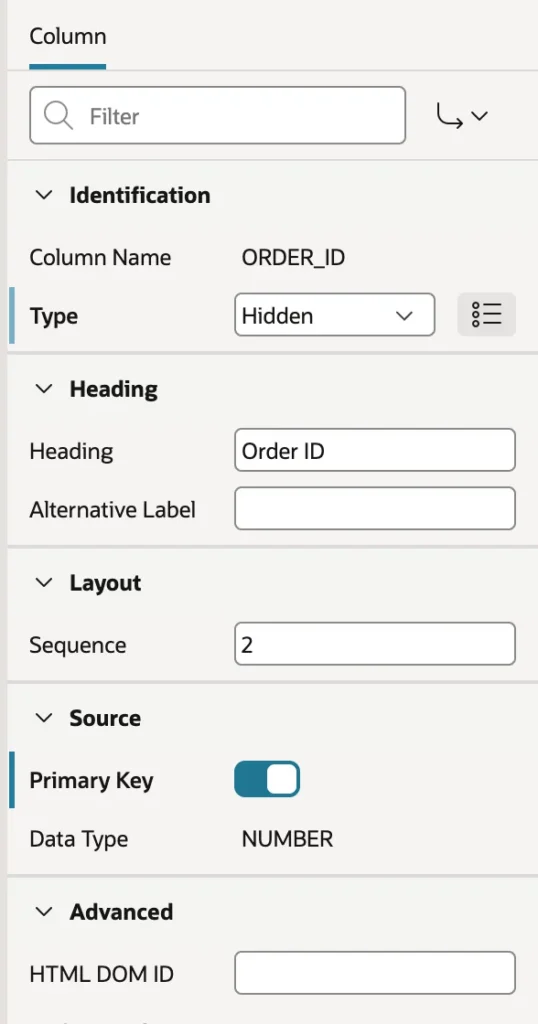
First, a primary key. APEX must know which column identifies each row, so set the key column's Type to Hidden and switch on Source Primary Key. Without it, the report fails with an error saying a primary key column is required for enabling selection.
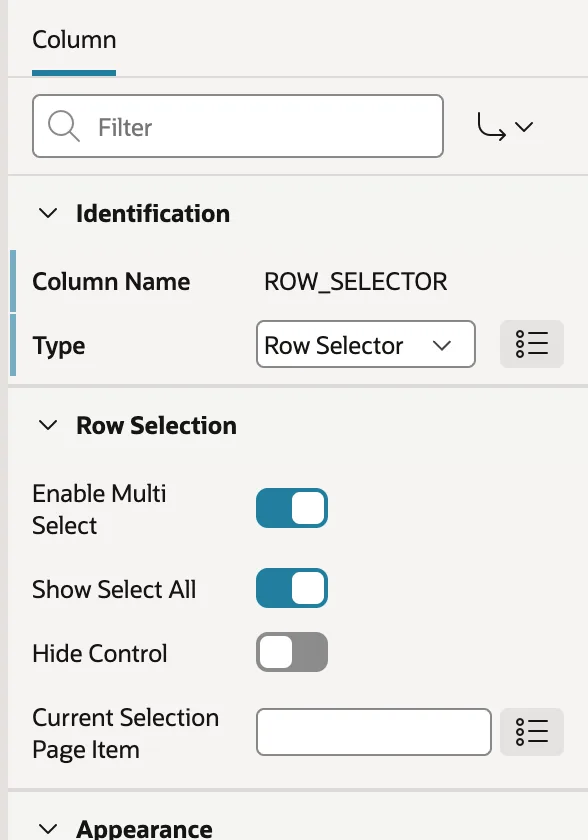
Second, a row selector column. Set the placeholder column's Type to Row Selector. Its properties decide whether users may select several rows, whether the heading gets a select all checkbox, and which page item receives the keys of the selected rows, ready for a process to read.
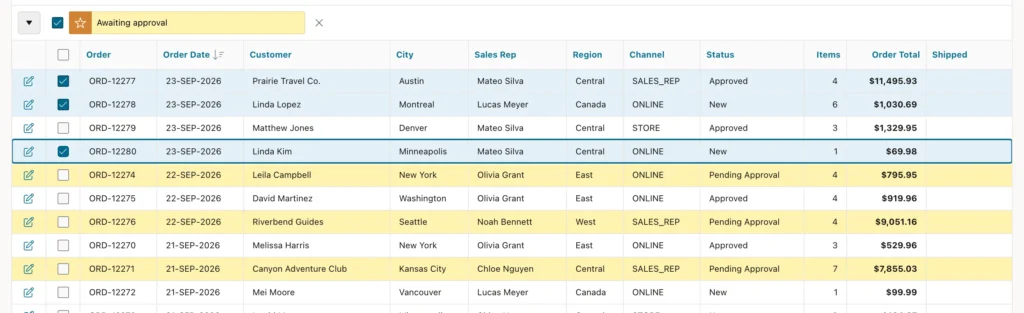
Note that a Hidden column is not the same as one the user has merely chosen not to display. Users cannot add a hidden column back with Actions, Columns, so use Hidden for keys and technical values. To hide a column users might want, remove it from the primary report's displayed columns before saving the default.
Controlling What Users Can Do
The report's Attributes tab decides which features users get.
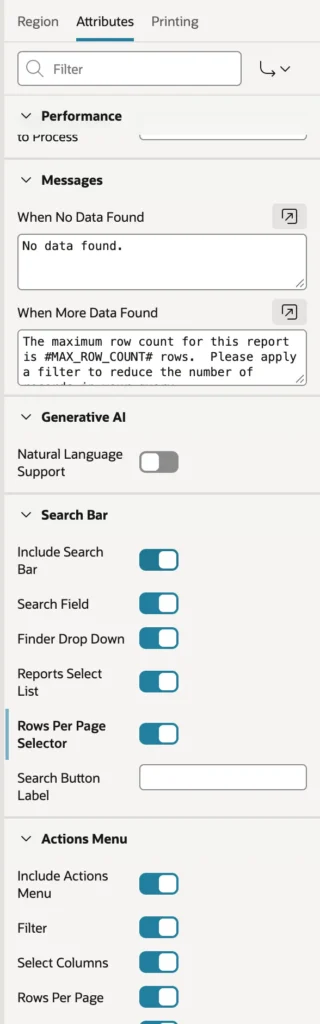
Search Bar switches the bar on or off, along with the search field, the column finder, the reports select list, and the rows per page selector. Actions Menu does the same for the whole menu and each entry in it, from Filter and Sort through Chart, Group By, Pivot, Flashback, Save Report, Download, and Subscription.
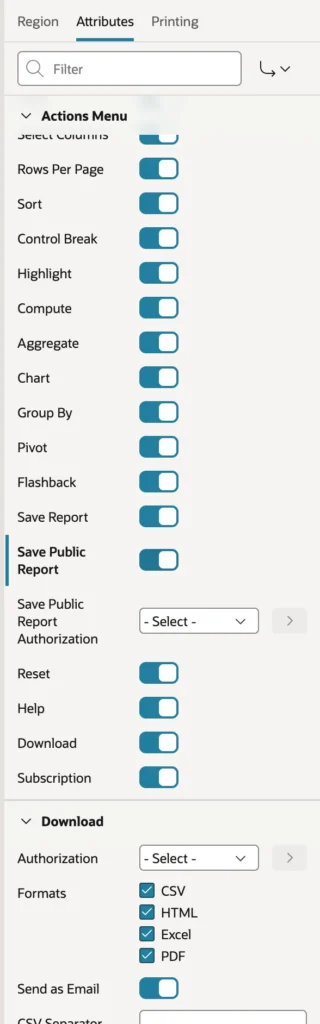
Save Public Report is off by default. Switch it on and, if you like, give it an authorization scheme, so only trusted users publish reports to everyone. Download chooses the available formats and whether reports can be emailed, and can be restricted by authorization too.
Column by Column
Each column has an Enable Users To group with switches for Hide, Sort, Filter, Highlight, Control Break, Aggregate, Compute, Chart, Group By, and Pivot. Switch off what makes no sense, such as grouping by an order number, or what would be too slow on a large table. Column Filter Type decides what the heading menu offers as filter values: distinct values from the data, or a list of values you define.
Every column also has an end-user alias, a letter that users see in the Compute and Row Filter dialogs.
Pagination and Performance
Pagination is simpler than in classic reports: row ranges with or without a total, or none. Maximum Rows to Process limits the rows the report reads, so an unfiltered search on a huge table cannot bring the database to its knees, and users who hit the limit are asked to filter.
APEX 26.1 adds Maximum Rows to Display, which caps the rows users can page through after their filters are applied, independently of the rows processed. The old limit of roughly 32,000 rows in a downloaded report has also been removed.
Heading Fixed To keeps column headings visible while scrolling, either to the page or to the region.
The Link Column and Saved Reports
Link Column adds the icon at the start of each row: a link to the single row view, a link to a custom target defined with the Link Builder, or no link column at all.
The Saved Reports node under the region lists the reports developers saved as default settings, the primary and any alternatives. Select one to see its visibility, its static ID for linking directly to it, and a link example. Named reports that users save are not listed, because they belong to the users.
Natural Language Support
APEX 26.1 lets users customize an interactive report by typing what they want, such as show pending orders in the West over 5,000 dollars, largest first. APEX sends the request, along with a description of the report's columns, to a large language model, which translates it into ordinary report settings.
The result is a normal report that users can inspect, change, and save. Switch on Generative AI Natural Language Support in the report's attributes, and a Search with AI option appears in the search bar. It requires a generative AI service configured for the application.
Conclusion
An interactive report gives every user a personal view of the data without a single extra line of code from you. Users search and filter, sort on several columns, highlight rows or cells, break the report into sections with aggregates, add computed columns, chart, group, and pivot, then download the result or have it emailed on a schedule, saving any of it as a named report. As the developer you set the primary default layout that everyone starts from, create alternative reports, and decide feature by feature and column by column what users may do, along with the pagination and row limits that keep a large table from overwhelming the database. APEX 26.1 adds row selection, which needs both a primary key column and a row selector column, per-column CSS classes, a separate cap on displayed rows, and natural language support that turns a plain sentence into ordinary report settings. Build the query well, set sensible defaults, and the report will answer questions you never thought to ask.
