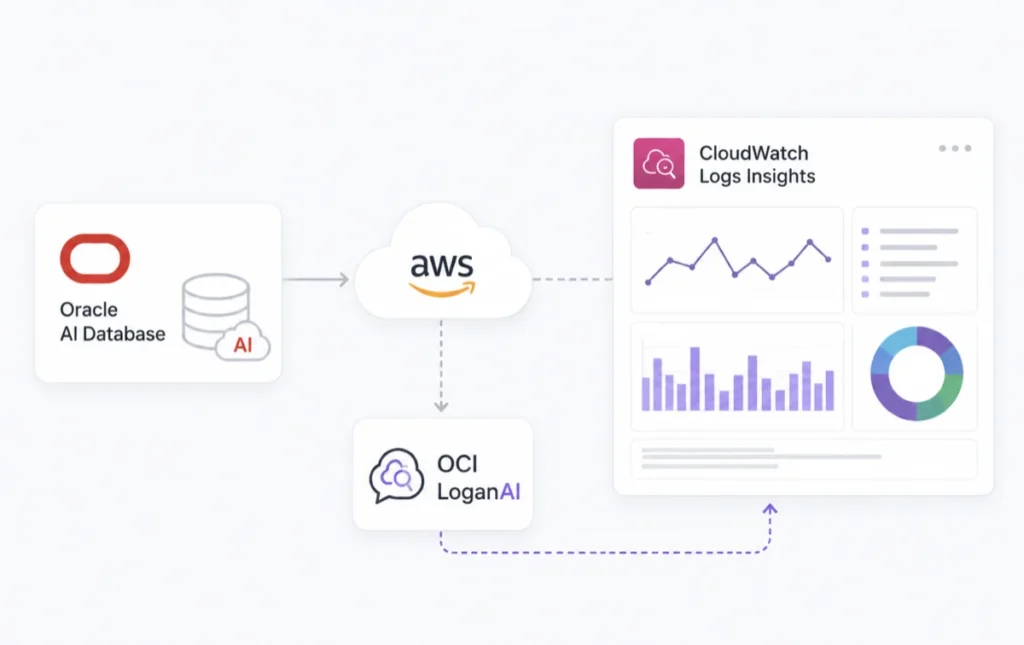
When you run Oracle AI Database on AWS, you end up managing audit and operational logs across two cloud planes simultaneously. OCI handles its own telemetry through Log Analytics, and AWS surfaces its log streams through CloudWatch. Neither plane alone gives you a complete picture, so the practical operating model pairs both tools in a defined sequence.
This article covers the configuration steps for enabling OCI LoganAI inside OCI Log Analytics and for querying Oracle-related signals in CloudWatch Logs Insights. The focus is on non-database operational logs, specifically OCI and AWS audit logs.
What OCI LoganAI Actually Does at the Architecture Level
LoganAI is a generative AI layer embedded directly into OCI Log Analytics. It does not replace query execution; it sits on top of it. After a query runs and returns a result set, LoganAI can summarize the pattern across those results, generate follow-up investigation prompts, and translate raw log fields into a plain-language operational context.
The underlying model varies by region. LoganAI routes to either a Meta Llama or Cohere model, depending on what is available in the OCI Generative AI region you select during setup. Log data leaves your current OCI region and is sent to that Generative AI region for inference. This cross-region data flow is the most important architectural constraint to document before you enable the feature, as it affects your data residency and internal governance posture.
Enabling LoganAI for Oracle AI Database@AWS Monitoring: Tenancy-Level Configuration
Enablement is done at the tenancy level through OCI Log Analytics administration. The steps below map to the actual console flow.
Navigate to Log Analytics Home and open Administration. Open the Service Details page for OCI Log Analytics and confirm the current LoganAI status, which defaults to Disabled. Select Configure LoganAI settings and set enablement to Yes.
Choose the OCI Generative AI service region that will handle inference requests. Then select the default compartment for Generative AI access. This compartment must be covered by the IAM policies you have in place for LoganAI; a mismatch here will cause validation to fail silently in some tenancy configurations.
Review and accept the required OCI Generative AI model licenses. You will also need to decide how license acceptance is handled for other users in the tenancy, either accepting on their behalf or requiring individual acceptance. Run Validate Settings and then Test to confirm connectivity to the Generative AI service endpoint. Save with Update LoganAI settings.
The Four Explain Modes and Where to Use Them
Once LoganAI is active, the Explain capability becomes available inside Log Explorer. You access it through the generative AI panel that appears alongside query results.
| Mode | Scope | Primary Use Case |
|---|---|---|
| Single Log Explain | One log record | Decode an individual event and ask follow-up questions against it |
| Multi-log Explain | Full query result set | Build a narrative across a time window instead of manually grouping records |
| Cluster Explain | Cluster visualization | Summarize recurring event families identified by the clustering algorithm |
| Chart Explain | AI-enabled charts | Connect visual anomalies in time-series charts to operational signals |
The Generative AI panel also surfaces key identifiers extracted from the log records, such as OCIDs for the affected log group, log object, and compartment. These identifiers let you navigate directly to the relevant OCI Logging resources without copying values by hand.
CloudWatch Logs Insights: Querying Oracle Signals on the AWS Side
CloudWatch is where AWS-originating operational logs land first. For Oracle AI Database@AWS environments, the most useful starting point is filtering for ORA- prefixed errors directly inside Logs Insights before escalating to OCI-side analysis.
Navigate to CloudWatch, then Logs, then Logs Insights in the AWS console. Select the target Log Group that receives Oracle operational output. Two query patterns cover the majority of initial triage work.
For a broad time-ordered view of the most recent 10,000 entries:
fields @timestamp, @message
| sort @timestamp desc
| limit 10000
For isolating Oracle database errors specifically:
fields @timestamp, @message
| filter @message like /ORA-/
| sort @timestamp desc
| limit 50
The ORA- filter returns the 50 most recent Oracle error entries. Common signals you should watch for include ORA-04031, which indicates shared pool memory exhaustion, and ORA-01555, which points to a snapshot-too-old condition usually caused by long-running transactions outrunning undo retention.
Field Indexes: The Configuration Fix That Actually Matters at Scale
When you are scanning across thousands of log groups or dealing with very high log volumes, CloudWatch Logs Insights query latency becomes a real operational problem. The direct fix is creating field indexes on the fields you query most frequently.
In the CloudWatch console, navigate to Log Groups, select the target group, and open Field Indexes under the Actions menu. Add index entries for fields like @message or any custom parsed fields you are filtering on. Field indexes eliminate full-scan behavior for those fields and directly reduce the amount of data scanned per query, which also reduces cost.
After running a Logs Insights query, you can use the Summarize results capability to invoke an AI-generated summary of the returned log set. This works similarly to LoganAI's multi-log explain mode but stays fully within the AWS console and AWS-native tooling.
Deciding Which Tool to Use at Which Point
The two systems serve different stages of a triage workflow rather than competing as equivalent alternatives.
| Scenario | Use CloudWatch Logs Insights | Use OCI Log Analytics with LoganAI |
|---|---|---|
| First-pass log search for an active incident | Yes, AWS-native speed and no added layers | No, adds cross-region latency for initial lookup |
| Pattern summarization across a large result set | Available via Summarize results | Deeper, with multi-log explain and follow-up prompts |
| Correlation across OCI and AWS log streams | No, scope is limited to AWS log groups | Yes, centralizes telemetry across both planes |
| AWS-native automation and alerting integration | Yes, direct integration with alarms and EventBridge | No, requires separate OCI-side event rules |
| Contextual explanation with OCID extraction | No | Yes, LoganAI extracts and surfaces relevant resource identifiers |
IAM Alignment: The Most Common Enablement Failure Point
The compartment you select for Generative AI access during LoganAI configuration must match the compartment referenced in your LoganAI IAM policies. If your OCI IAM policy grants access at a parent compartment but you specify a child compartment in the LoganAI settings, the Validate Settings test will pass while actual inference requests fail at runtime.
The policy statement you need grants the Log Analytics service principal the ability to use generative AI inference endpoints. Verify that the compartment OCID in the policy condition block exactly matches what you set in step 5 of the enablement flow.
Conclusion
For Oracle AI Database@AWS environments, you have two distinct log analysis surfaces with different strengths. Use CloudWatch Logs Insights for fast, AWS-native filtering with the ORA- query pattern and field indexes to keep scan costs under control. Use OCI Log Analytics with LoganAI when you need cross-cloud correlation or AI-assisted pattern explanation that goes beyond a single query result.
The cross-region data flow introduced by LoganAI is the configuration decision that most affects your architecture. Confirm your OCI Generative AI region selection against your data residency requirements before enabling it, and verify the IAM compartment alignment carefully to avoid silent inference failures after enablement succeeds.