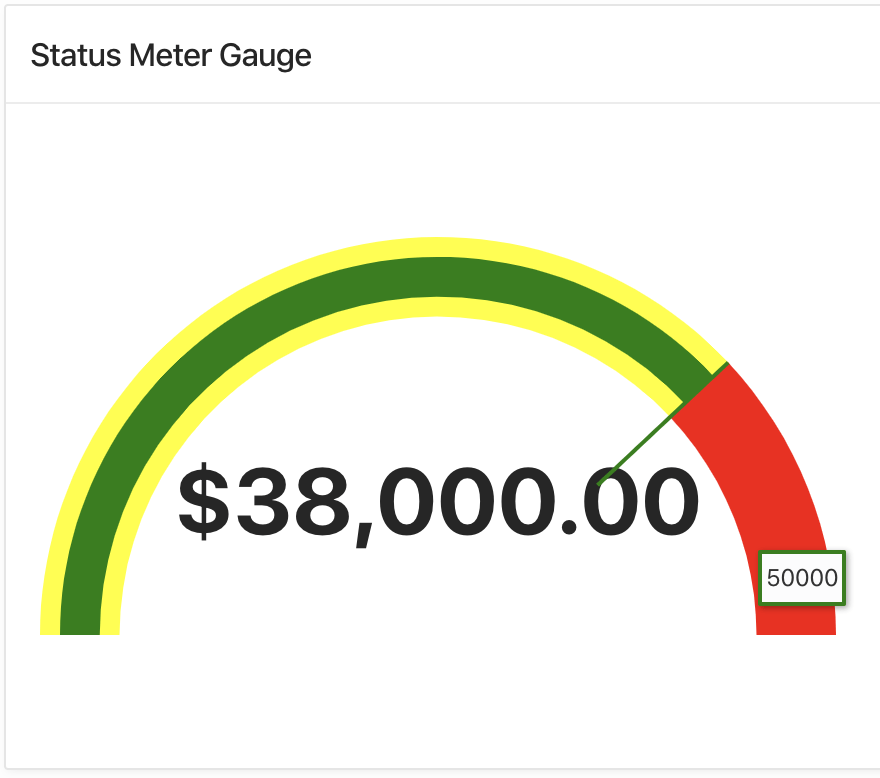
This example shows, how to create a Status Meter Gauge chart in Oracle Apex.
SQL Query Example for Status Meter Gauge Chart
SQL query should return a single row, you can get the data by using functions such as MAX(), MIN(), SUM(), etc. or get the values directly for a single row. In the following SQL query example, it will fetch the target sales value and the actual sales value for the current day from the table DAILY_SALES:
select target_value, sales_value from daily_Sales where cdate = trunc(sysdate);
Steps to Create Status Meter Gauge Chart in Oracle Apex
- Create a region in Oracle Apex, do the right-click on the Region node and select Create Region option and then set the following properties:
- Title: Status Meter Gauge
- Type: Chart
- Then click on the Attribute node of the region and set the following properties:
- Type: Status Meter Gauge
- Title: Sales Status
- Maximum Width: 400
- Maximum Height: 300
- Gauge > Orientation: Circle
- Show Plot Area: Yes (Turn on the switch)
- Indicator Size: .5
- Inner Radius: .8
- Start Angle: 180
- Angle Extent: 180
- Value > Value Type: Number
- Format: Currency
- Then click on the Series node and set the following properties:
- Source > Type: SQL Query
- SQL Query:
select target_value, sales_value from daily_Sales where cdate = trunc(sysdate); - Column Mapping > Label:
TARGET_VALUE - Value:
SALES_VALUE - Maximum Value:
TARGET_VALUE - Custom Tooltip:
TARGET_VALUE - Appearance > Color: Green
- Threshold > Values:
&SALES_VALUE., &TARGET_VALUE. - Colors: yellow, red
- Display: All
- Reference Lines > Values:
&SALES_VALUE. - Colors: Green
The following is the screenshot for the above settings:
There are lots more options to set for the chart. Now save the changes and run the page, you will have the output as shown below:
Related tutorials:
- Oracle Apex 19.2: Create a Faceted Search Region (New Feature)
- Oracle Apex 19.2: Create Star Rating Page Item (New Feature)


how can I download this graph/chart ?